Data Preprocessing
4 min read

Unsung Hero of Data Analysis
What if we tell you that there’s an unsung hero of data analysis,
and it’s not the flashy algorithms, intricate models, or complex equations, but it’s called
data preprocessing?
Data preprocessing can transform raw, messy data into a treasure trove of insights.
What is Data Preprocessing?
Data preprocessing is the art of cleaning, transforming, organizing your data, and getting your data ready for analysis. This data can come in various forms. It could be spreadsheets, survey responses, sensor readings, or even text documents.
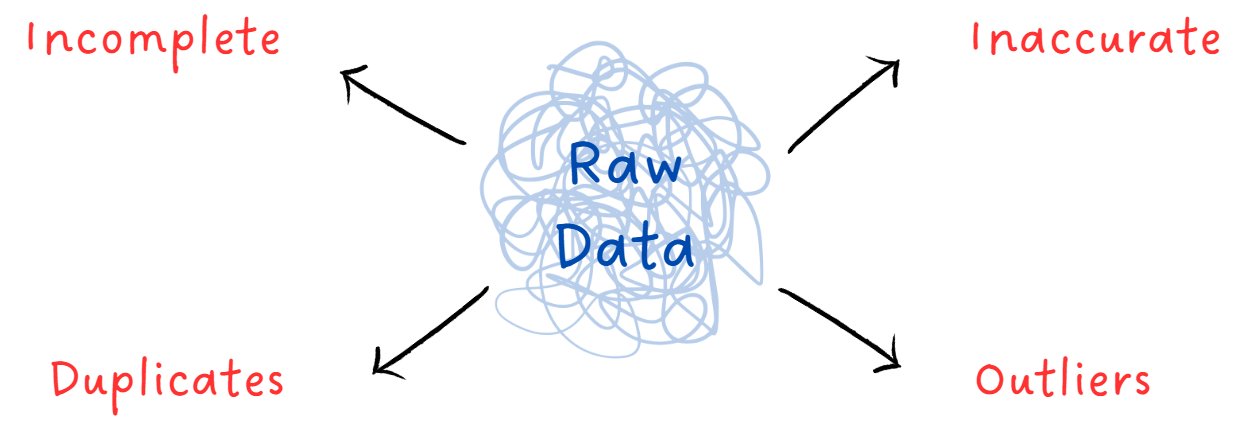
But why raw data might not be ready yet for analysis?
Because raw data often has issues. Issues like missing values,
outliers, and inconsistencies.
Imagine if you were conducting a customer satisfaction survey. Some respondents might
skip the questions or provide contradictory responses (rating a product highly but
providing negative comments about it). Issues like these can create gaps and
inconsistencies in the data.
What other issues? What’s the way out?
Raw data can be:
| Issue Number 1 | Example |
|---|---|
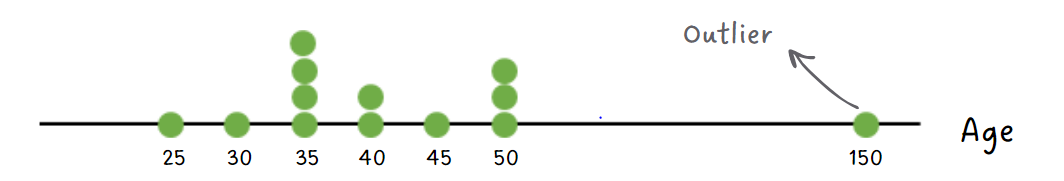
| Outliers: Extreme values that can skew the analysis | In a dataset of people's ages, if an entry claims someone is 150 years old, it's likely an outlier |
| Solution |
|---|
| Satistical Techniques: For instance, we can calculate the mean and standard deviation (SD) of a dataset and remove data points that fall outside a certain range (e.g., >2 SD away from the mean). This helps to eliminate extreme values that could distort our analysis. |
| Issue Number 2 | Example |
|---|---|
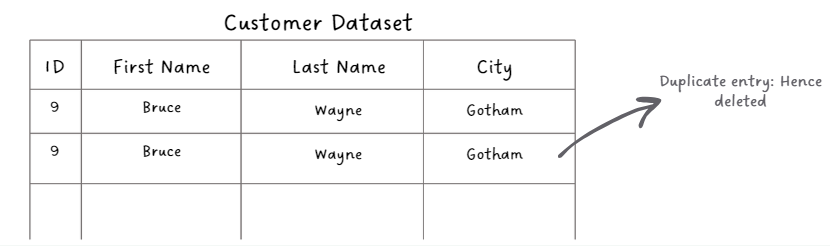
| Duplicate Entries: Same entry listed multiple times | In a customer dataset, the same customer is listed multiple times with slight variations in their information. |
| Solution |
|---|
| Data deduplication techniques: This involves identifying identical or near-identical records and either merging them or selecting the most reliable one. |
| Issue Number 3 | Example |
|---|---|
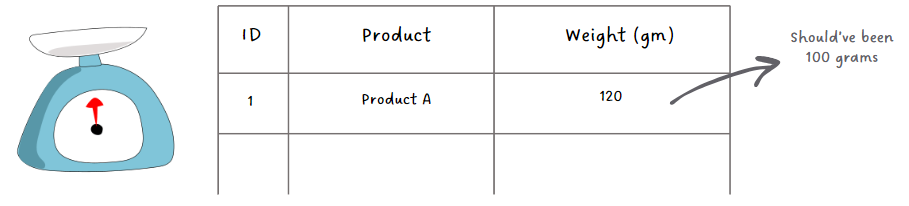
| Inaccurate Data: Incorrect or erroneous information | A manufacturing machine reports a product's weight, but the machine's scale is not calibrated correctly. |
| Solution |
|---|
| Data Validation: Checking data against predefined rules or ranges to identify and correct inaccuracies. It's similar to verifying that a weighing machine is calibrated correctly before taking a weight reading. |
| Issue Number 4 | Example |
|---|---|
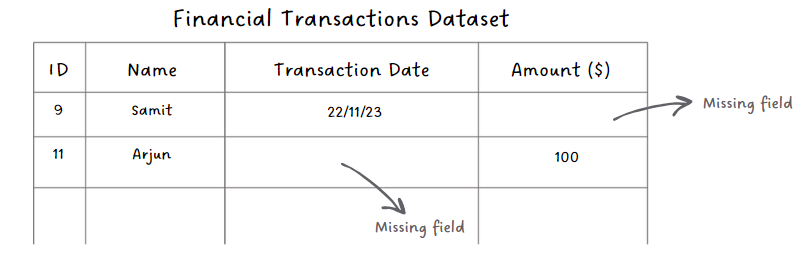
| Incomplete Data: Missing elements | In a dataset of financial transactions, some records might lack essential information, such as a transaction date or amount. |
| Solution |
|---|
| Imputation Methods: Involves filling in missing values with educated guesses. For example, if we have missing transaction dates, we might infer them based on the surrounding data or use statistical methods to estimate the missing values. |
Once we've preprocessed the data and it's cleaner, we move on to
data transformation. This step involves converting the data into a more suitable format or
structure for analysis. Data transformation can involve a range of operations, such as
scaling, normalizing, and encoding so that the data is ready for analysis.
Let us explain this in detail.
Data Transformation
Feature Scaling
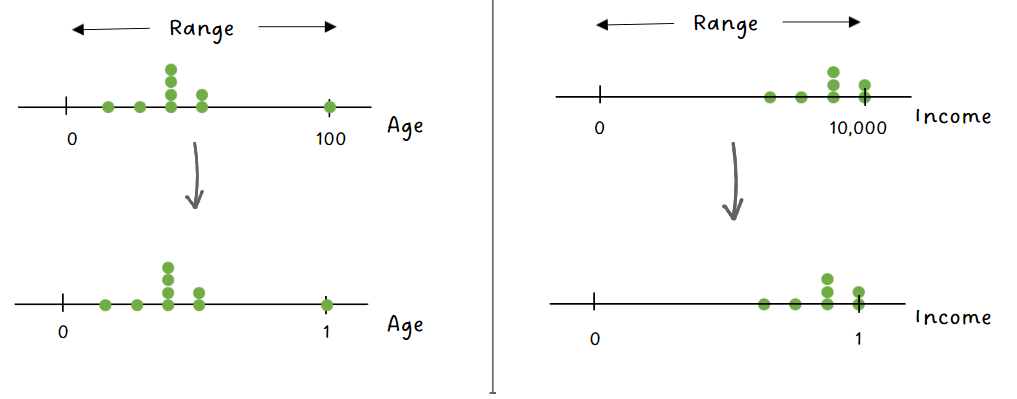
In some cases, the range of values in the dataset can vary widely. For instance, income figures can be substantially larger when dealing with a dataset that includes income and age. Scaling ensures that each feature contributes proportionally to the analysis by bringing them to a similar scale, often between 0 and 1.
Now, both ‘Age’ and ‘Income’ are on the same scale: between 0 and 1
Encoding Categorical Data
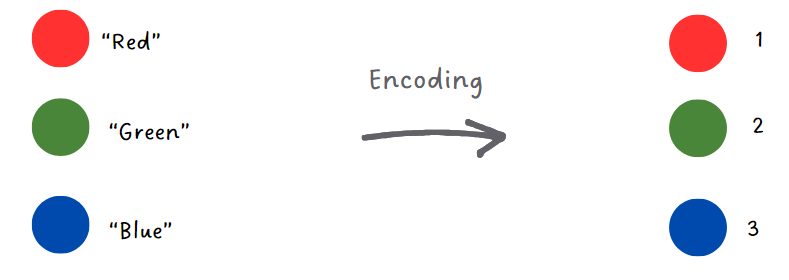
Most machine learning algorithms work with numerical data and
encoding of categorical data is a way to convert words or labels into numbers. It's like
giving each category a unique code or number.
For instance, let’s say our cars dataset has cars of "red," "green," and "blue" colors.
Encoding would assign each color a number, such as "Red" becoming 1, "Blue" becoming 2, and
"Green" becoming 3. This numeric representation allows algorithms to use this information in
calculations and analysis.
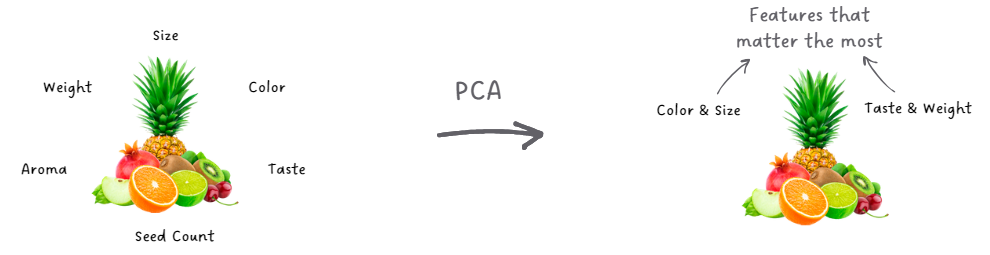
Principal Component Analysis
Principal Component Analysis, or PCA, identifies the most vital
details in data and creates a condensed version that captures its essence.
Imagine we have a variety of fruits, each described by several features like color, size,
taste, and weight. We want to understand what makes each fruit unique. PCA sorts through all
these features and identifies the main directions (components) in which the fruits vary the
most. It might find, for example, that color or size vary significantly across different
fruits, whereas taste or weight might show less variation.
The first step in PCA is to find the most distinguishing feature combination – the one that
shows the biggest differences between the fruits. This could be a mix of size and color.
Then, PCA searches for the next most distinguishing set of features that provide new,
different information. This might be a blend of weight & taste, offering insights that the
combination of size & color doesn't.
PCA then combines these informative features into what we call "principal components.” These
are new, simplified features that summarize the original data. The first principal component
could be a balance of size and color that together tell us a lot about each fruit. The
second principal component could be another combination, like weight and taste, giving us
another perspective. These components help us understand the essence of the fruits without
needing to consider every single feature in isolation.
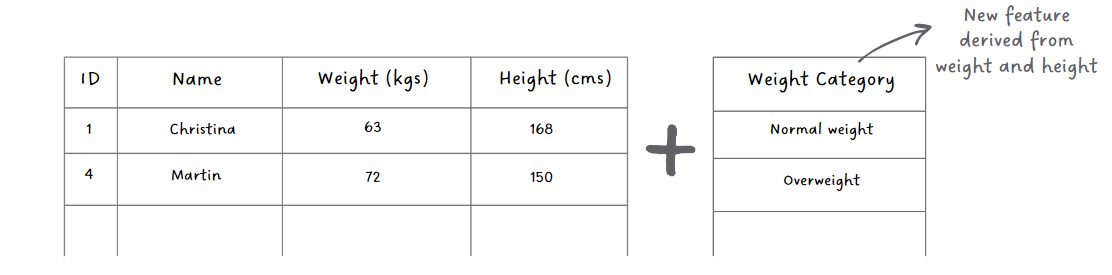
Creating Derived Features
Sometimes, the information that we need is not present in our data
directly. So, we create new, more informative features from the ones we already have to
improve our predictions.
Imagine we have data on people's height and weight, but we want to know if they're
underweight, normal weight, or overweight. To do this, we can create a new feature called
'Weight Category' based on their Body Mass Index (BMI). If their BMI is low, they're
underweight; if it's in the middle, they're normal weight; and if it's high, they're
overweight. This 'Weight Category' feature simplifies understanding and using the data for
weight classification.
And that's it for now!
Once we have the data ready we can feed it into machine learning algorithms. We will discuss some of these algorithms in future posts.
Have any burning questions or specific topics you'd like us to explore? Share your thoughts at hi@simplifyingstuff.com
Share