Introduction to Analytics
4 min read

Numbers have a story to tell
Picture this: You walk into your favorite local café, NewWave Coffee. They've got a cool game going on—guess how many cups of coffee they serve each day, and if you're close, you get a free coffee! Lots of excited customers made their guesses. When the manager announced the answer, it turned out that even though everyone's guesses were different, when you added them up and divided, the average was really close to the actual number of cups they serve.
It's interesting how all those different guesses, when pooled together, create a pretty accurate picture, a concept known as the wisdom of crowds. This seemingly simple coffee game offers a fascinating glimpse into the world of analytics. Let’s dive right into it.
So what is Analytics?
Simply put, analytics is the process of using data and patterns to uncover insights, understand trends, and make informed decisions. It’s everywhere - from the social media posts you scroll through to the movies you stream online.
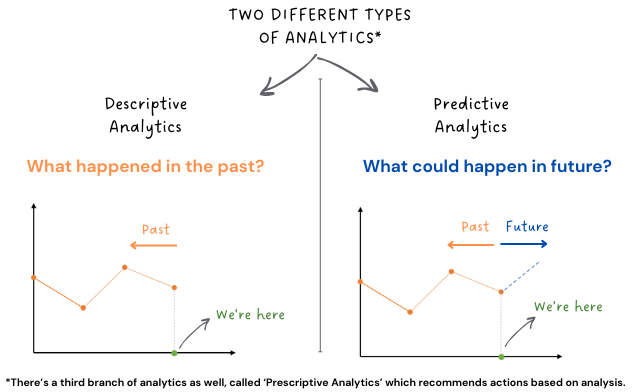
Let’s understand these types in a bit more detail.
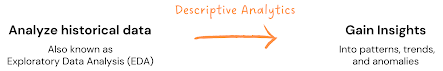
Descriptive Analytics is like a storyteller, it takes the raw data and turns it into a compelling story, painting a clear picture of what has happened in the past.
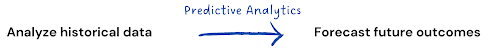
Predictive Analytics on the other hand, uses historical data to find patterns in the past which might also predict what is likely to happen in the future.
Now, NewWave Coffee is run by smart people who understand the importance of data and analytics. They have diligently collected data on their daily customer orders throughout the past year. This wealth of information plays a crucial role in their operational strategies. Let’s see how.
By analyzing data, NewWave Coffee:
- Identifies peak hours and uses this data to recognize the busiest hours, aiding in workforce scheduling for efficient service. This ensures that every latte, cappuccino, and espresso shot is served promptly, maintaining a seamless customer experience
- Smartly manages inventory. Through data analysis, NewWave optimizes inventory levels, ensuring shelves are stocked according to historical consumption patterns
- Identifies the preferences of its customer base allowing tailored offerings and ensuring a personalized experience for patrons that tickles its customers' taste buds
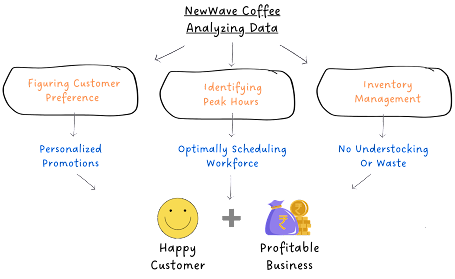
Understanding customer preferences, identifying peak hours, and managing inventory are key aspects of descriptive analytics.
While descriptive analytics provides a snapshot of the present, the real world demands the ability to foresee future needs and trends. Predictive analytics steps in to meet this necessity. Among the most common methods for making predictions are Regression and Classification.
Regression
Imagine NewWave Coffee now wants to know how the temperature affects the number of iced coffee drinks they sell each day. By using regression analysis, they can predict the number of drinks they will sell based on the temperature on that particular day.
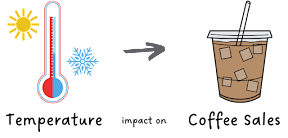
Regression is all about finding the relationship between a dependent variable (in our case, the number of drinks sold) and one or more independent variables (in our case, temperature). It helps us understand how changes in the independent variable affect changes in the dependent variable.

So for NewWave Coffee, regression would give us a mathematical equation that predicts coffee sales based on specific temperatures. Don't worry, we'll delve into this equation and its insights in our upcoming editions. We will explain in a way that makes it intuitive and super easy to grasp.
Now let’s talk about the other method of prediction: Classification
Classification
Let’s say NewWave Coffee is introducing new coffee flavors: "Vanilla," "Caramel," and "Hazelnut” and they want to offer personalized recommendations to customers based on their flavor preferences.
Classification, a method of organizing data into categories, becomes essential in this scenario. NewWave collects data on customer preferences, including age, gender, past orders, etc., and creates a classification model. This model learns to recognize connections between customer attributes and their flavor choices.
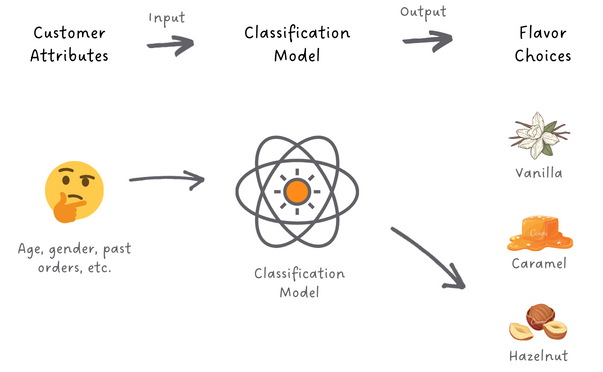
Whenever a new customer places an order, the model analyzes the customer's attributes and swiftly classifies their preference - 'Vanilla,' 'Caramel,' or 'Hazelnut’ - the flavor that resonates with each customer's unique palate.
And there you have it! A glimpse into the fascinating world of analytics. We've just scratched the surface, but don't worry, we'll be back soon with more simplified explanations. In the next edition, we'll dive into Linear Regression.
Have any burning questions or specific topics you'd like us to explore? Share your thoughts at hi@simplifyingstuff.com
Share