Linear Regression
4 min read
Data Stories in Real Estate
While browsing the internet, let’s say you discover a fascinating article about Villow, a real estate company, that employs machine learning to predict housing prices with astounding accuracy.
Intrigued, you delved deeper into the world of predictive modeling and stumbled upon the concept of linear regression.
Linear Regression?! What? Let‘s jump right into it.
Exploring the Depths of Linear Regression
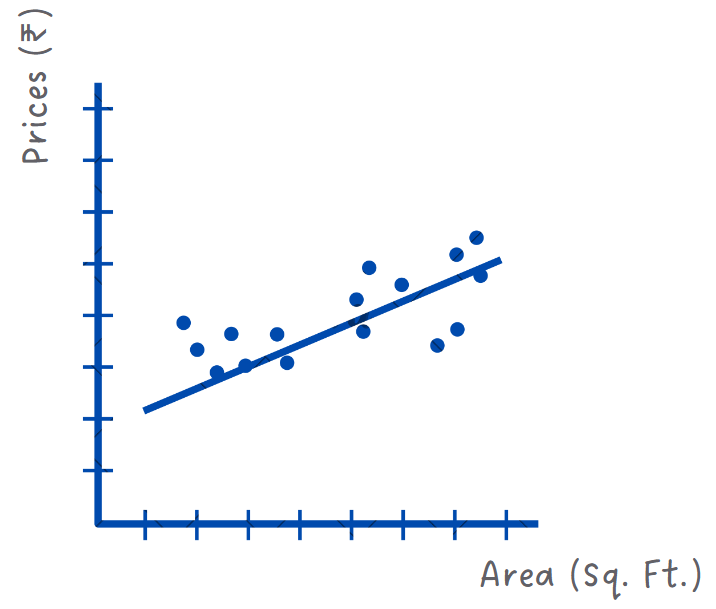
Linear regression is finding the right slope to draw a line through a cloud of points on a graph.
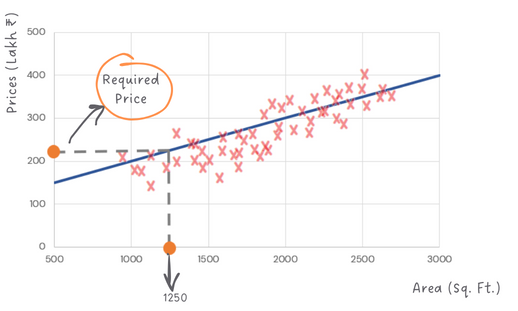
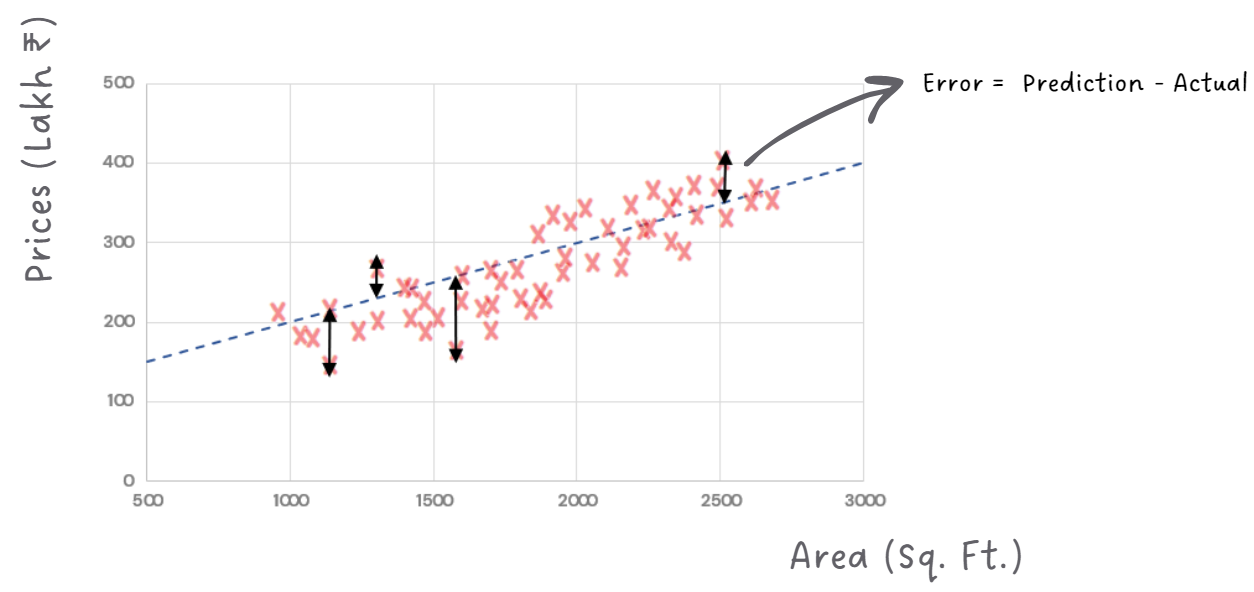
Imagine you have a bunch of data points that show the size of different houses and their corresponding prices. The goal is to draw a line that best fits these points so we can predict the price of a house given its size. Say you want to find the price of a house, with Size = 1250 sq. ft. You can easily estimate it from the graph of this line!
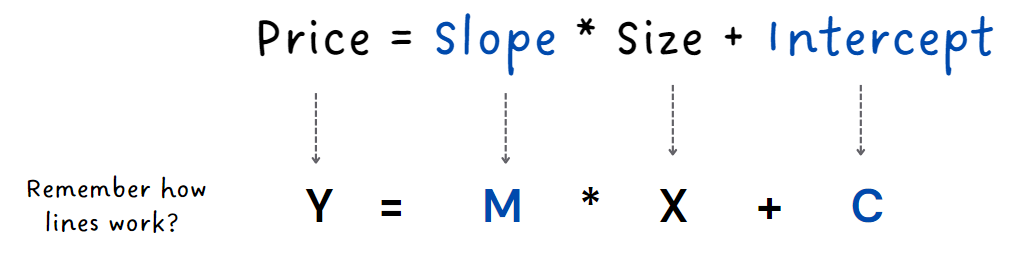
Linear regression is called so because it involves fitting a straight line (a linear function) to a set of data points to understand how a house's price (what we want to predict, also called independent variable) changes with its size (what we already know, also called the dependent variable).
But how do we find equation of this line in the first place?
We begin by gathering data on house sizes and their corresponding prices. Then, we use a process called "training" to find the equation of the line that best fits through these data points. But how do we determine the best-fitting line? Check where the difference between the predicted prices (the prices estimated by the line) and the actual prices is as small as possible. The gap between the predicted price of a house and its actual selling price is the error, and yes you’re right - our goal is to minimize the error!
To make this line as accurate as possible, we need to determine the right slope and intercept. These are just fancy terms for figuring out the angle and starting point of our line. We use the training data and try different values for slope and intercepts aiming to predict house prices as closely as possible to the real prices.
Trying different combinations of slope and intercept to find best-fitting line:
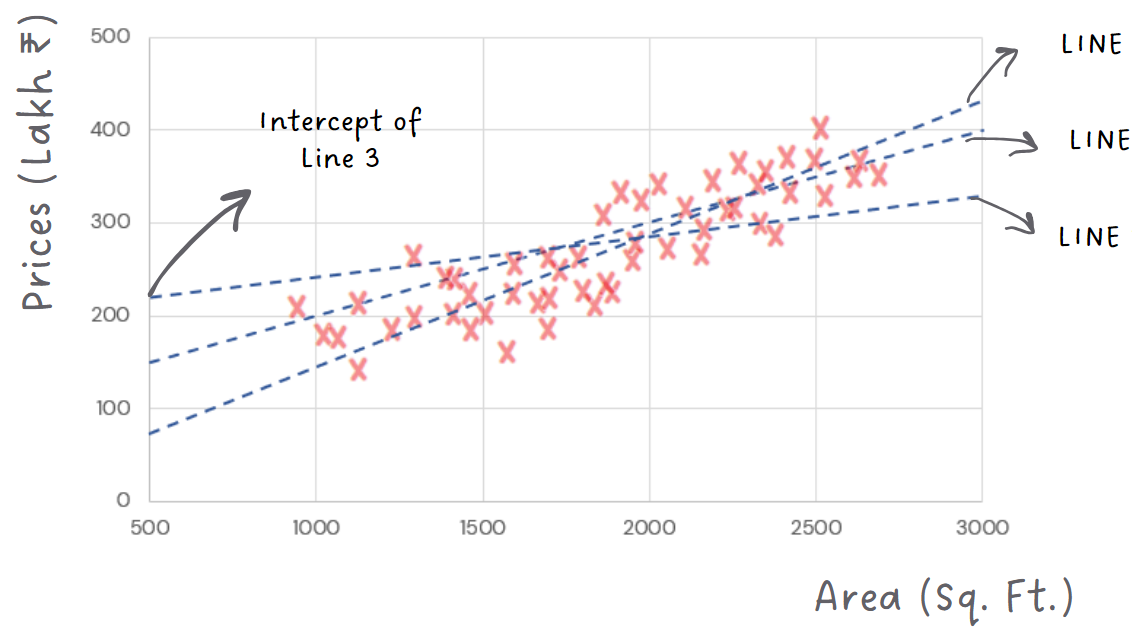
The idea is to try different slopes and intercepts for the line until we find the combination that minimizes the difference between the predictions and the actual prices in the training data.
We want a line close to the points because we want errors to be minimized!
But But But.... Sometimes a single line might not be enough.
Multiple regression
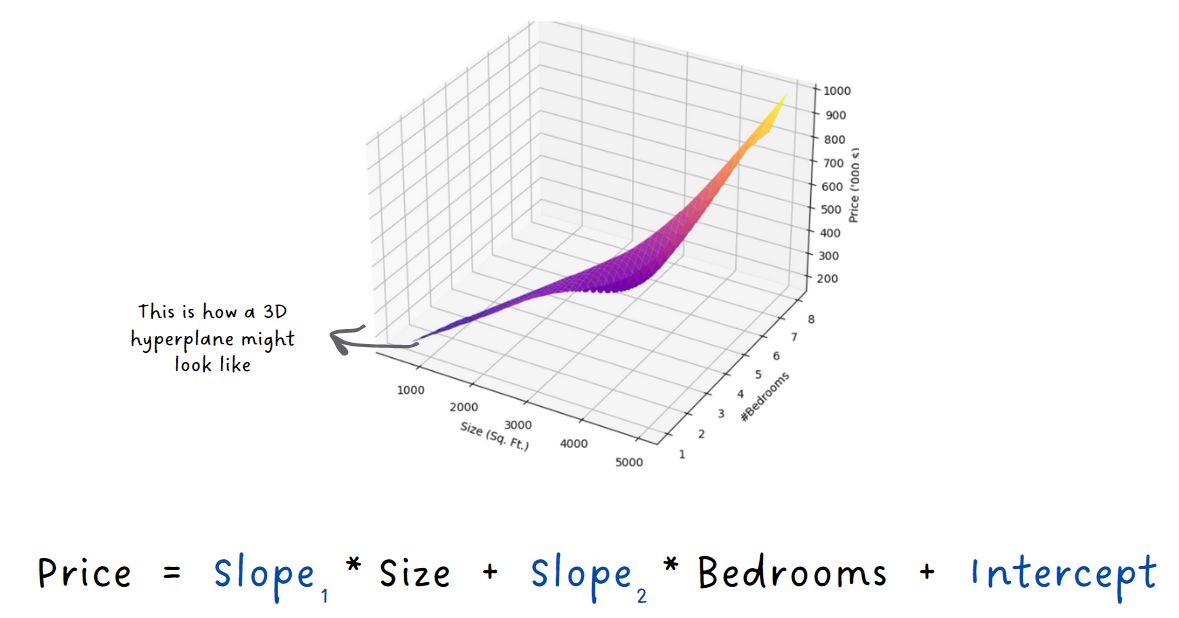
In real world, there are often multiple factors that influence the housing price. That's when we turn to the marvelous "multiple linear regression"

Instead of just considering house size, we take into account other relevant features that can impact the price, like the number of bedrooms, and the size of the house. So now, instead of a simple line, we have a hyperplane that best fits the data points in this multi-dimensional space.

So now, our magical formula for predicting the housing price involves all these different features. 'But the principles remain the same – we still aim to minimize the difference between our predictions and the actual prices.'
A cool trick called 'Optimization' helps us find this perfect line
or hyperplane through the data. One of the optimization techniques is called
"gradient descent."
It sounds complex, let's simplify it.
Imagine you are standing on top of a hill. Each point on this hill
represents a specific value of the intercept and the slope. The height at any point on the
hill corresponds to the error of our predictions as compared to the actual prices. Your goal
is to reach the bottom of the hill, where the error is at its lowest. To get there, you need
to move step by step, and each step corresponds to a new combination of slope and intercept
values for the line.
Taking random steps in any direction could lead you away from the bottom and be inefficient.
Instead, you want to take steps in the direction where the hill has a downward inclination.
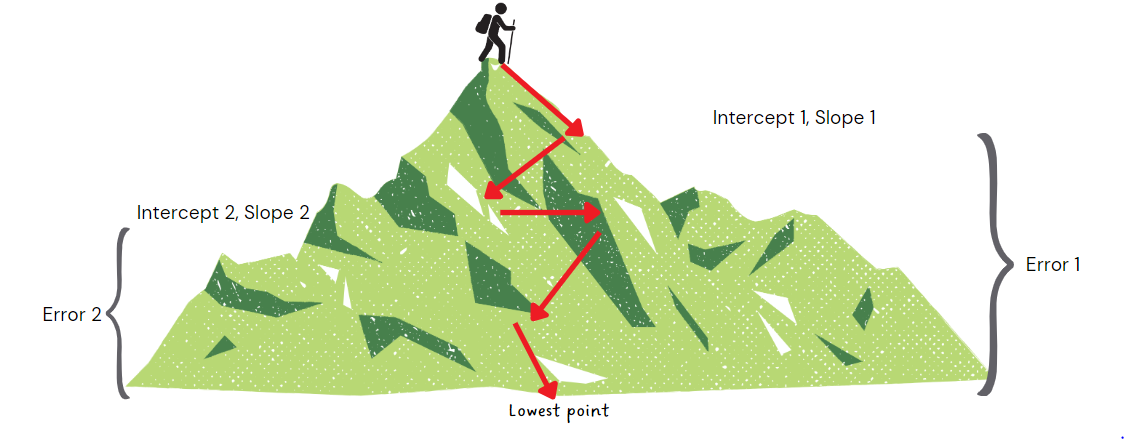
In this context, the steepness of the hill's inclination is what we call the "gradient." So, at each step, you calculate the gradient, and move in the direction of the steepest gradient. This gets you closer to the bottom of the hill, where the error is minimized.
The slope and intercept values you end up with at the bottom represent the best-fitting line for the given training data, giving you the ideal equation for making predictions.
So, the gradient tells us which way to move to find the perfect
line. Isn’t that beautiful?
However, note that gradient descent is an iterative process. We take small steps and repeat
the process until we reach a point where further adjustments won't significantly decrease
the overall error. That is we have reached the bottom of the hill. This helps us find the
best possible fit for our data and achieve more accurate predictions.
We found the perfect line but how can we be sure it is good at making predictions?
After the training, we put our model to the test using a separate
set of data that it has never seen before – we call it the testing set. We ask our line
equation to predict prices for these unseen houses and compare the predictions with the
actual prices.
It's like giving our equation of the line a pop quiz.
We evaluate the performance by calculating the error. The lower the error, the better our
line is at predicting housing prices accurately.
Real-World Business Use-Case
Linear Regression in Retail: Optimizing Sales Forecasts
Imagine a leading retail brand aiming to optimize its sales
strategies. With stores worldwide, the brand has accumulated vast datasets detailing past
sales, advertising expenditures, store dimensions, customer demographics, and typical
spending amounts.
Linear Regression plays a pivotal role in understanding the relationship between sales and
elements such as advertising spend, store size, and customer behavior, hence offering
precise forecasts of potential sales revenue.
For instance, it might reveal that increased advertising in a specific age demographic leads
to a significant spike in sales. Or perhaps larger store sizes in urban areas correspond to
higher revenue, while in suburban areas, it's the customer's average spending that holds
more sway.
Armed with these insights, the retail brand can fine-tune its marketing campaigns, redesign
store layouts, or even personalize customer experiences. In a competitive market, such
data-driven decisions, guided by linear regression, can pave the way for increased
profitability and market dominance.
Have any burning questions or specific topics you'd like us to explore? Share your thoughts at hi@simplifyingstuff.com
Share