Principal Component Analysis
5 min read

What really matters in data?
Have you ever looked at your closet full of clothes and struggled to
decide what to wear? You might have many items, but only a few of them really define your style.
This situation is similar to facing a large set of data and trying to find out what's most
important in it.
Just like picking out the key pieces that define your wardrobe, wouldn't it be great if we could
identify the most significant elements in a set of data?
This is where Principal Component Analysis, or PCA, comes into picture. PCA helps us simplify
complex data by focusing on the most important aspects, much like choosing the best pieces from
a vast collection of clothes to define your unique style.
Understanding PCA in detail
PCA, or Principal Component Analysis, is a dimensionality reduction technique. which simplifies complex data while retaining the essential information. To understand dimensionality reduction, let's first understand high-dimensional and low-dimensional data.
High-Dimensional Data (High Dimensionality)
Imagine we're working on a project where we have a collection of
high-resolution face images in our dataset. For each face, we're noting down various details
like:
- The colors of each tiny dot (pixel) in the image, with their corresponding pixel values
- How bright or dark each color is (Red, Green, Blue (RGB) channels)
- Precise locations, the coordinates, of key facial points like the eyes, nose, and mouth
- Facial expressions, like how the eyebrows are angled or the shape of the mouth
In the dataset, each image is represented by a high-dimensional feature vector containing thousands of dimensions. For example, a 100x100 pixel image in RGB color would result in 30,000 dimensions (100 * 100 * 3).
Low-Dimensional Data (Low Dimensionality)
Now, let's consider a scenario where we want to perform facial
recognition, but you decide to use a simpler representation of the data. Instead of
capturing pixel-level details and facial landmarks, we decide to focus on fundamental facial
characteristics like:
- The average color of the face
- The distance between the eyes
- The width of the nose
- The distance between the nose and the mouth
In this scenario, we've substantially reduced the data's dimensionality. We've gone from thousands of dimensions down to just a few, perhaps five or six dimensions.
High Dimensionality
Contains a vast amount of information, which can be incredibly detailed. However, working with high-dimensional data can be computationally expensive, challenging for visualization, and may require extensive storage and processing power.

Low Dimensionality
By reducing the dimensionality, we simplify the dataset while still capturing essential facial features. This can make processing faster, visualization more accessible, and storage requirements lower.
So sometimes it is beneficial to reduce the dimension of data, and PCA helps with that. Essentially
PCA can help strike a balance by reducing high-dimensional data to a manageable, yet informative, low-dimensional representation.
So, in essence, dimensionality reduction is simplifying the data by trimming down the number
of features. This makes data analysis less complicated, and, most importantly, maintains the
core information we need for our tasks.
However, there is another important reason why reducing the dimensions of data is useful.
Reducing data dimensions helps prevent a problem called overfitting.
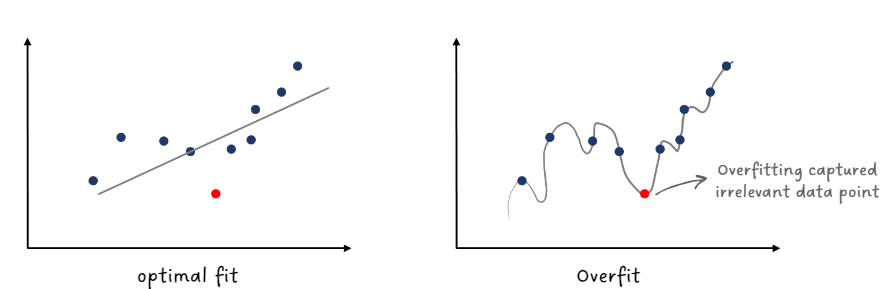
Overfitting
Overfitting occurs when a machine learning model learns to perform exceptionally well on the
training data but performs poorly on new, unseen data.
This issue arises because the data may contain irrelevant or random fluctuations,
particularly in high-dimensional spaces with
numerous features. The model can mistakenly learn from these irrelevant features during the
learning process, making our analysis overly specialized on the training data and less
effective when applied to new, unseen data.
But how does PCA deal with Overfitting?
- Dimensionality Reduction: By reducing the number of dimensions, PCA simplifies the data representation. This reduces the complexity of the model, making it less prone to overfitting. Instead of working with thousands of dimensions, the model operates on a smaller set of transformed features generated by PCA.
- Feature Decorrelation: PCA also ensures that the new dimensions (also called principal components) are uncorrelated. This means that each principal component captures a different aspect of the data’s variance. By removing correlations between features, PCA reduces the risk of the model being misled by spurious relationships among variables.
So, in a way, PCA helps the model focus on the most critical information in the data and prevents it from getting distracted by irrelevant or noisy features.
PCA is like highlighting the main points in a text and ignoring the less relevant details.
How does PCA actually work?
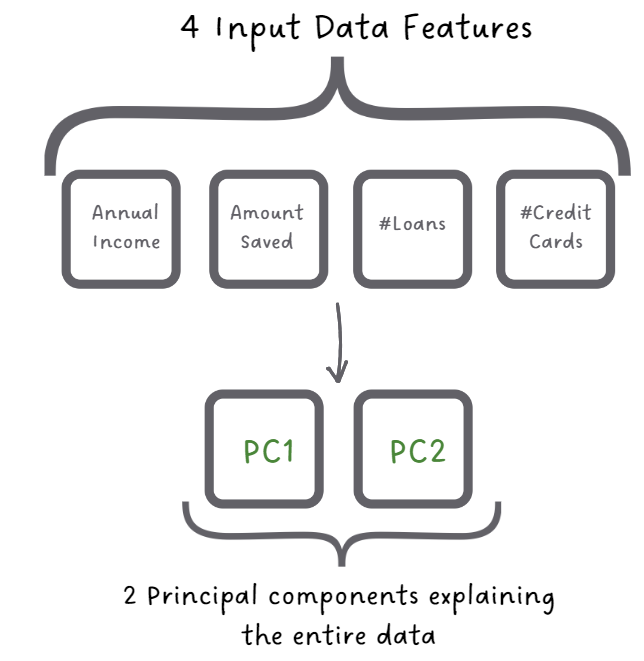
Picture yourself as an analyst working for a financial institution, and you have a dataset
containing information about financial behaviors of the customers. For each customer, you
have 4 features: their annual income, the amount they have saved, the number of loans they
have taken, and the number of credit cards they own.
Now, you want to gain insights into the customers' financial habits and potentially use this
information to make more informed lending decisions. However, dealing with four features can
be a complex affair. This is where PCA comes in:
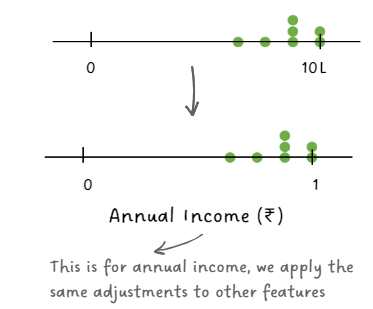
Standardization
First, you make sure all the data plays on the same field by standardizing it. This means you adjust the values to have a similar scale so that no single aspect dominates the analysis.
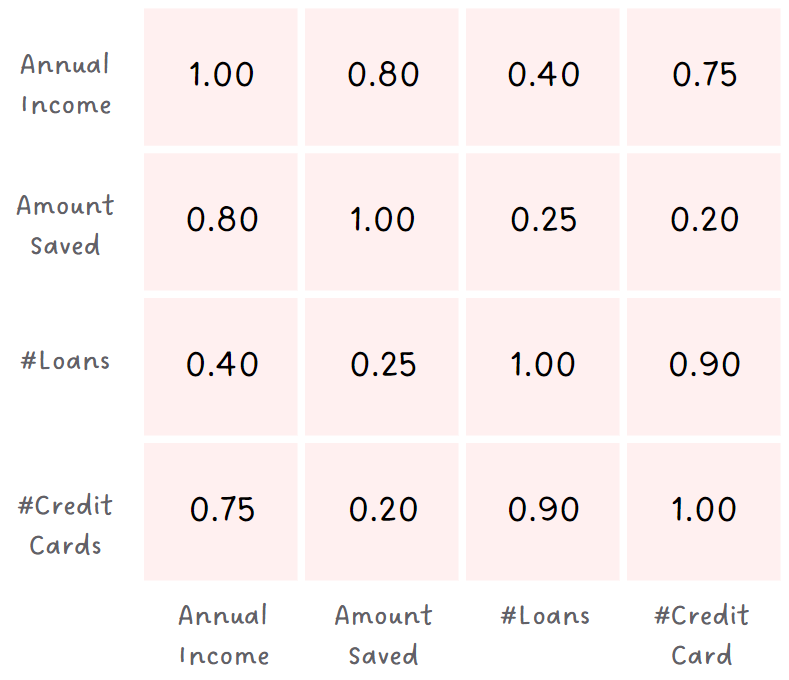
Covariance Matrix
Next, you create a matrix to see how each pair of features is related. For example, if income and savings often go up together, it means that customers with higher incomes tend to have higher savings and the matrix shows it.
Decomposition to Principal Components
In this step, PCA analyzes the covariance matrix, which shows how each pair of features in your data is related. It then identifies the direction where the data varies the most and calls them Principal Components (Hence the name: Principal Component Analysis!!). These directions (The directions of PC1 and PC2 in the adjacent figure) capture the most information from the data.

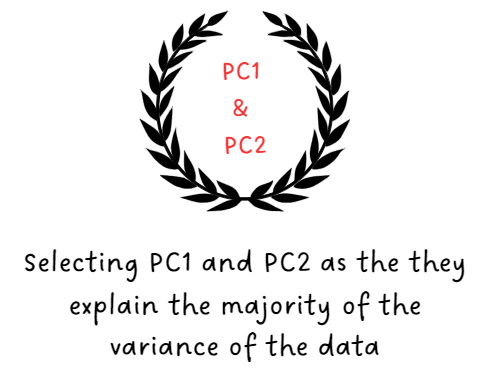
Selecting Principal Components
After sorting the Principal Components with the amount of variance captured, from highest to lowest, you figure that the first principal component explains the majority of the variance, followed by the second component and you decide to keep only these two principal components.
Transforming Data
Finally, you transform your customer data into a new space defined by these two principal components. Each customer's financial behavior is summarized by just two values, one along each of the selected principal components. These values capture the essential financial characteristics of each customer.
With this reduced-dimensional representation, you can perform various tasks more effectively. For example, you can group customers with similar financial behaviors, identify potential outliers, or even build predictive models for credit risk assessment.
Have any burning questions or specific topics you'd like us to explore? Share your thoughts at hi@simplifyingstuff.com
Share